Trait Definitions
Understanding Hereford EPDs
The American Hereford Association (AHA) currently produces expected progeny differences (EPDs) for 17 traits and calculates three profit indexes. AHA’s genetic evaluation makes use of a Marker Effects Model that allows the calculation of EPDs by incorporating the pedigree, phenotypic and genomic profile of an animal. Animals that have a genomic profile will be denoted with a GE-EPD logo.
The current suite of Hereford EPDs and profit indexes includes:
Calving Ease — Direct (CE)
CE EPD is based on calving ease scores and birth weights and is measured on a percentage. CE EPD indicates the influence of the sire on calving ease in females calving at 2 years of age. For example, if sire A has a CE EPD of 6 and sire B has a CE EPD of -2, then you would expect on average, if comparably mated, sire A’s calves would have an 8 percent more likely chance of unassisted calving when compared to sire B’s calves.
Birth Weight (BW)
BW EPD is an indicator trait for calving ease and is measured in pounds. For example, if sire A has a BW EPD of 3.6, ands ire B has a BW EPD of 0.6, then you would expect on average, if comparably mated, sire A’s calves would come 3 lb. heavier at birth when compared to sire B’s calves. Larger BW EPDs usually, but not always, indicate more calving difficulty. The figure in parentheses found after each EPD is an accuracy value or reliability of the EPD.
Weaning Weight (WW)
WW EPD is an estimate of pre-weaning growth that is measured in pounds. For example, if sire A has a WW EPD of 60 and sire B has a WW EPD of 40, then you would expect on average if comparably mated, sire A’s calves would weigh 20 lb. heavier at weaning when compared to sire B’s calves.
Yearling Weight (YW)
YW EPD is an estimate of post-weaning growth that is measured in pounds. For example, if sire A has a YW EPD of 100 and sire B has a YW EPD of 70, then you would expect on average if comparably mated, sire A’s calves would weigh 30 lb. heavier at a year of age when compared to sire B’s calves.
Dry Matter Intake (DMI)
The DMI EPD predicts the daily consumption of pounds of feed. For example, if sire A has a DMI EPD of 1.1, and sire B has a DMI EPD of 0.1, you would expect sire B’s progeny, if comparably mated, to consume on average 1 pound of feed less per day.
Scrotal Circumference (SC)
Measured in centimeters and adjusted to 365 days of age, SC EPD is the best estimate of fertility. It is related to the bull’s own semen quantity and quality, and is also associated with age at puberty of sons and daughters. Larger SC EPDs suggest younger age at puberty. Yearling sons of a sire with a 0.7 SC EPD should have yearling scrotal circumference measurements that average 0.7 centimeters (cm) larger than progeny by a bull with an EPD of 0.0 cm.
Sustained Cow Fertility
The AHA’s new SCF EPD is a prediction of a cow’s ability to continue to calve from three years of age through 12 years of age, given she calved as a two-year-old. The EPD is expressed as a deviation in the proportion of the 10 possible calvings to 12 years old expressed as a probability. For example, the daughters of a bull with a 30 EPD would have the genetic potential to have one more calf by age 12 than the daughters from a bull with a 20 EPD. In other words, the daughters from the 30 EPD bull would have a 10% greater probability of having one more calf than the bull with a 20 EPD. This is equivalent to saying that the daughters are 10% more likely to remain in the herd to age 12.
Maternal Milk (MM)
The MM EPD of a sire’s daughters is expressed in pounds of calf weaned. It predicts the difference in average weaning weights of sires’ daughters’ progeny due to milking ability. Daughters of the sire with a +14 MM EPD should produce progeny with 205-day weights averaging 24 lb. more (as a result of greater milk production) than daughters of a bull with a MM EPD of -10 lb. (14 minus -10.0 = 24 lb.). This difference in weaning weight is due to total milk production during the entire lactation.
Maternal Milk & Growth (M & G)
The M & G EPD reflects what the sire is expected to transmit to his daughters for a combination of growth genetics through weaning and genetics for milking ability. It is an estimate of the daughter’s progeny weaning weight. A bull with a 29 lb. M & G EPD should sire daughters with progeny weaning weights averaging 19 lb. heavier than progeny of a bull’s daughters with a M & G EPD of 10lb.(29minus10=19lb.).It is equal to one-half the sire’s weaning weight EPD, plus all of his MM EPD. No accuracy is associated with this since it is simply a mathematical combination of two other EPDs. It is sometimes referred to as “total maternal” or “combined maternal.”
Maternal Calving Ease (MCE)
MCE EPD predicts how easily a sire’s daughters will calve at two years of age and is measured on a percentage. For example, if sire A has a MCE EPD of 7, and sire B has a CE EPD of -3, then you would expect on average if comparably mated, sire A’s daughters would calve with a 10% more likely chance of being unassisted when compared to sire B’s daughters.
Mature Cow Weight (MCW)
The MCW EPD was designed to help breeders select sires that will either increase or decrease mature size of cows in the herd. The trait was developed after years of cow weight data collection and the EPD relates directly to the maintenance requirements of a cow herd. For example, if sire A has a MCW EPD of 100, and sire B has an EPD of 85, then you would expect the females of sire A, if comparably mated, to be 15 lb. heavier at mature size.
Udder suspension (UDDR)
UDDR EPDs are reported on a 9 (very tight) to 1 (very pendulous) scoring scale. Differences in sire EPDs predict the difference expected in the sires’ daughters’ udder characteristics when managed in the same environment. For example, if sire A has a UDDR EPD of 0.4, and sire B has a UDDR EPD of -0.1, the difference in the values is 0.5, or one-half of a score. If daughters of sires A and B are raised and managed in the same environment, you would expect half a score better udder suspension in daughters of sire A, compared to sire B.
Teat size (TEAT)
TEAT EPDs are reported on a 9 (very small) to 1 (very large, balloon shaped) scoring scale. Differences in sire EPDs predict the difference expected in the sires’ daughters’ udder characteristics when managed in the same environment. For example, if sire A has a teat size EPD of 0.4, and sire B has a teat size EPD of -0.1, the difference in the values is 0.5, or one-half of a score. If daughters of sires A and B are raised and managed in the same environment, you would expect half a score smaller teat size in daughters of sire A, compared to sire B.
Carcass Weight (CW)
CW EPD is a beneficial trait when considering the impact that pounds have relative to end product value. At the same age constant endpoint, sires with higher values for carcass weight will add more pounds of hot carcass weight compared to sires with lower values for carcass weight. For example, if sire A has a CW EPD of 84, and sire B has a CW EPD 64, then you would expect the progeny of sire A, if harvested at the same age constant endpoint, to have a 20-lb. advantage in terms of hot carcass weight.
Rib Fat (FAT)
The FAT EPD reflects differences in adjusted 365-day, 12th-rib fat thickness based on carcass measurements of harvested cattle. Sires with low, or negative FAT EPDs, are expected to produce leaner progeny than sires with higher EPDs. Ultrasound measures are also incorporated into this trait and have been shown to be highly correlated with the performance of slaughter progeny. All data is expressed on a carcass scale.
Ribeye Area (REA)
REA EPDs reflect differences in an adjusted 365-day ribeye area measurement based on carcass measurements of harvested cattle. Sires with relatively higher REA EPDs are expected to produce better- muscled and higher percentage yielding slaughter progeny than will sires with lower REA EPDs. Ultrasound measurements are also incorporated into this trait and have been shown to be highly correlated with the performance of slaughter progeny. All data is expressed on a carcass scale.
Marbling (MARB)
MARB EPDs reflect differences in an adjusted 365-day marbling score (intramuscular fat, [IMF]) based on carcass measurements of harvested cattle. Breeding cattle with higher MARB EPDs should produce slaughter progeny with a higher degree of IMF and therefore higher quality grades. Ultrasound measurements are also incorporated into this trait and have been shown to be highly correlated with the performance of slaughter progeny. All data is expressed on a carcass scale.
Baldy Maternal Index (BMI$)
The BMI$ is a maternally focused index that is based on a production system that uses Hereford x Angus cross cows. Progeny of these cows are directed towards Certified Hereford Beef. This index has significant weight on Sustained Cow Fertility, which predicts fertility and longevity of females. There is a slightly positive weight on Weaning Weight, Mature Cow Weight and Milk which accounts for enough growth but ensures females do not increase inputs. There is some negative emphasis on Dry Matter Intake, but a positive weighting on Carcass Weight which is anticipated to provide profitability from finishing of non-replacement females and castrated males. Marbling and Rib-eye Area are also positively weighted to keep the harvested progeny successful for CHB. This index is geared to identify Hereford bulls that will be profitable when used in a rotational cross with mature commercial Angus cows.
Brahman Influence Index (BII$)
The BII$ is a maternally focused index
that is based on a production system that uses Brahman x Hereford cross cows. Progeny of these cows are directed towards a commodity beef market since Certified Hereford Beef© does not accept Brahman influenced cattle. This index has significant weight on Sustained Cow Fertility, which predicts fertility and longevity of females. There is a slightly positive weight on Weaning Weight, Mature Cow Weight and Milk which accounts for enough growth but ensures females do not increase inputs. There is some negative emphasis on Dry Matter Intake, but a positive weighting on Carcass Weight which is anticipated to provide profitability in finishing non-replacement females and castrated males. Marbling and Rib-eye Area are also positively weighted to keep harvested progeny successful for a variety of commodity based programs. This index targets producers that use Hereford bulls on Brahman influenced cows.
Certified Hereford Beef Index (CHB$)
CHB$ is a terminal sire index that is built on a production system where Hereford bulls are mated to mature commercial Angus cows and all progeny will be targeted for Certified Hereford Beef© after the finishing phase. This index has significant weight on Carcass Weight to ensure profit on the rail. As well there is a positive weighting for Average Daily Gain along with a negative weighting on Dry Matter Intake to ensure efficient pounds of growth in the finishing phase. Keep in mind, this production system takes advantage of complimentary breeding with the commercial Angus cow. Although Marbling is weighted positively in this index, a positive weighting for Rib-eye Area and a negative weighting for Back Fat are a greater priority in this index to allow for optimum end-product merit. This is the only index that has no emphasis on fertility. Remember that no replacement heifers are being retained.
Udder Scores
Udder quality represents one of the most important convenience traits in commercial beef production. Some would argue that udder quality represents an economic trait as poor udders require additional labor inputs and thereby decrease profitability.
Seedstock producers should manage udder quality closely, says Bob Weaber, University of Missouri Extension beef genetics specialist. “Your commercial customers expect trouble-free cattle when they make a purchase at your farm or ranch. Don’t give your customers a reason to buy genetics from another source to ‘clean up’ udders produced by your bulls.”
Cows with good udder quality not only take less labor but also may have improved longevity due to lower incidence of mastitis or injury. “Poor udders, especially large teat size, may delay timely colustrum intake by calves, resulting in poorer transmission of passive immunity,” Weaber explains. Hereford breeders are encouraged to report udder scores to the American Hereford Association (AHA) to be utilized in genetic evaluation.
In July 2008 the Beef Improvement Federation (BIF) adopted a two-score system for evaluating udders. The AHA Board of Directors followed suit and adopted the same system during its August 2008 meeting.
Udder and teat quality are two of the most important functional traits. Udder and teat soundness are a concern for a number of reasons: 1. Labor associated with extra costs and reduced convenience; 2. Longevity, which may be reduced because of injury or mastitis; 3. Calf performance, affected by a reduction in milk flow, or lower colostrum intake by newborn calves having difficulty nursing oversized teats; and 4. Udder and teat characteristics appear to be heritable. This means that there is definitely is variation in the udder quality of daughters from different sire groups. Thus, change can be made through selection.
Teat size
Scores range from 9 (Very Small) to 1 (Very Large, balloon shaped) and are subjective assessments of teat length and circumference. Oversized teats are difficult for newborn calves to nurse and the calf may not receive adequate colostrum, which could lead to a higher incidence of scours or decreased immunity levels in the newborn calf. In Canadian studies, cows with more desirable teat scores had calves that nursed sooner after birth.
Udder suspension
Scores range from 9 (Very Tight) to 1 (Very Pendulous) and represent assessments of udder support. Weak udder suspension results in pendulous udders that make it difficult for a calf to nurse. Weak suspension in the udder indicates a lack of support in the ligament that ties the udder to the cow’s body wall. Over time, weakness in this ligament will allow the udder to hang down too far from the body and may subject the udder to serious problems and increased potential for injury.
How to score
Udder and teat scores should be taken (on the weakest quarter) within 24 hours of calving. Scores should preferably be taken by the same person throughout the calving season. With the new system, producers score both teat size and udder suspension. The scores for both characteristics range from 1 to 9.
“A two-score system allows independent evaluation of teat size and suspension characteristics,” Weaber says. “While there is a general trend for cows with large teat size to also have poorer suspension, this is not always the case. The independent scoring of the two important udder quality traits allows more precise measurement of each trait. Even though these scores are subjective, they’ll do a better job documenting variation in udder quality than a single-score system. When the two scores are used, the heritability estimates for each trait should be higher due to increased precision of measurement.”
Weaber suggests producers get in the habit of scoring udders when they collect calving ease data. “Make udder score collection a routine part of your performance data collection,” he says. “Until you get comfortable with the scoring system, tape a scoring guide to your clipboard or reduce on a copy machine and tape in your ‘red book’ for use in the field. Try to get as close as you can to the guide and be as consistent as possible.
“Once you do it for a while, you’ll start picking out the really good ones and really bad ones easily. Be honest with yourself and use as much of the scale as needed. If she’s a ‘1’ on suspension and ‘1’ on teat size, give the scores. Your customers expect it!”
Submitting scores
Hereford breeders record udder scores on the Registration Application/Birth Information Worksheet (Form 1). According to Jack Ward, AHA chief operating officer and director of breed improvement, with the new system, breeders will list the score in the same field used previously, but instead of recording one score, they will input the two digits. The first digit will be the udder suspension (attachment) score, and the second digit will be teat size. For example, if a cow has an attachment score of 7 and a teat size of 5, the breeder will record 75 in the “dam udder score” column.
Research shows udder and teat characteristics are heritable; thus, change can be made through selection. “Consistent and steady progress can make dramatic improvements in udder quality,” Weaber says. “Help yourself and your customers by selecting for and culling on udder quality. Improving and monitoring udder traits will pay dividends in the long run.”

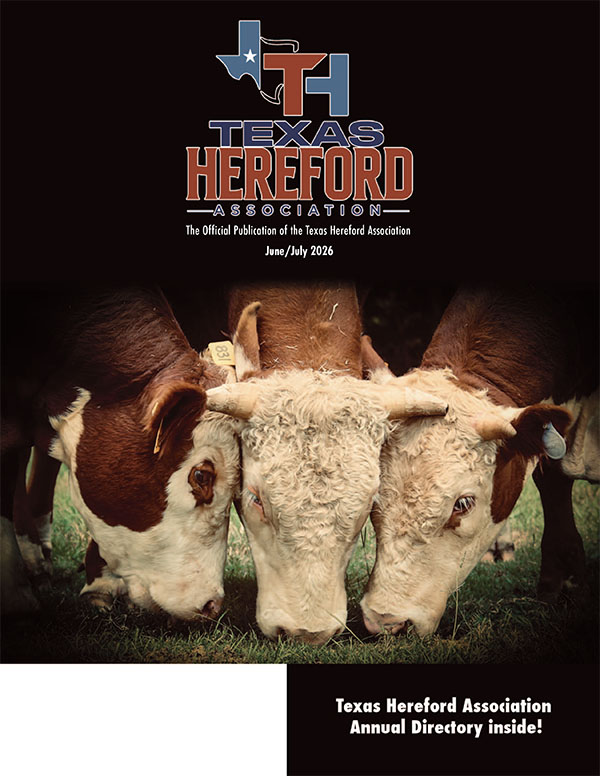
 Udder score 21
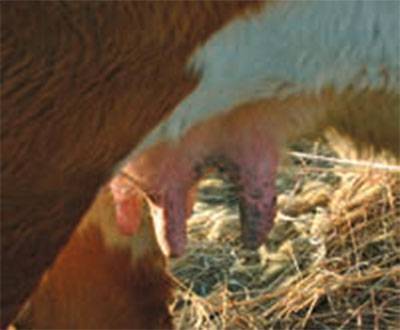
 Udder score 33
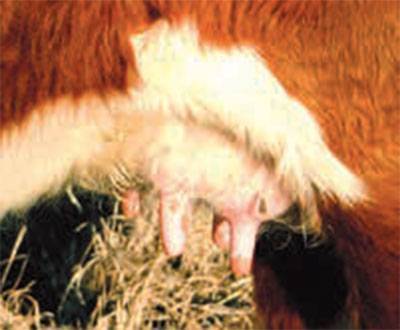
 Udder score 55
 Udder score 74
 Udder score 77
 Udder score 99
Udder EPDs Released
With the release of the spring 2015 Pan-American Cattle Evaluation (PACE), the AHA released two new expected progeny differences (EPDs) for udder quality.
The two traits — udder suspension (UDDR) and teat size (TEAT) — were first released on the web. You can find them by going to Hereford.org and clicking on “EPD Search.” They are located in the EPD trait box positioned right after maternal cow weight (MCW). This first release will be the trait by itself with no correlations to other traits, and there will not be a genomic impact with genomic enhanced-expected progeny differences (GE-EPDs).
There were around 200,000 udder observations included in the first evaluation, and the heritability for both UDDR and TEAT is about .34, which makes this trait fairly highly heritable, so genetic progress can be made rather quickly.
The correlation between the two scores and one is .72, so it makes all udder scores useful in this evaluation. This EPD can be used the same as other EPDs and will allow you to compare animals and, most importantly, has the potential to change udder quality between sire groups.
This scoring system is not concerned with milk flow or production; those will be measured with the weaning weight (WW) and milk and growth (M & G) EPDs. All we are looking at with this trait is the type of udder and teat.
Both UDDR and TEAT EPDs are reported on the scoring scale. Differences in sire EPDs predict the difference expected in the sires’ daughters’ udder characteristics when managed in the same environment.
For example, if sire A has a UDDR EPD of 0.4, and sire B has a UDDR EPD of -0.1, the difference in the values is 0.5, or one-half of a score. If daughters of sires A and B are raised and managed in the same environment, you would expect half a score better udder suspension in daughters of sire A, compared to sire B.
Likewise, if sire A has a teat size EPD of 0.4, and sire B has a teat size EPD of -0.1, the difference in the values is 0.5, or one-half of a score. If daughters of sires A and B are raised and managed in the same environment, you would expect half a score smaller teat size in daughters of sire A, compared to sire B.
Just like with the scoring system, the higher the EPD the better for both traits.
These are important traits to analyze because commercial producers demand genetics that are problemfree. The loss of time, longevity and calf performance due to a poor quality udder cannot be tolerated.
Remember that it is important to continue to collect udder scores within 24 hours of calving — the closer to calving time, the better. It is also important to understand that there is no perfect score, but it is the ranking and the differences within the herd that are important.